What a Record El Niño Could Mean for Sierra County
History says a strong El Niño guarantees the northern Sierra nothing.
10 min read
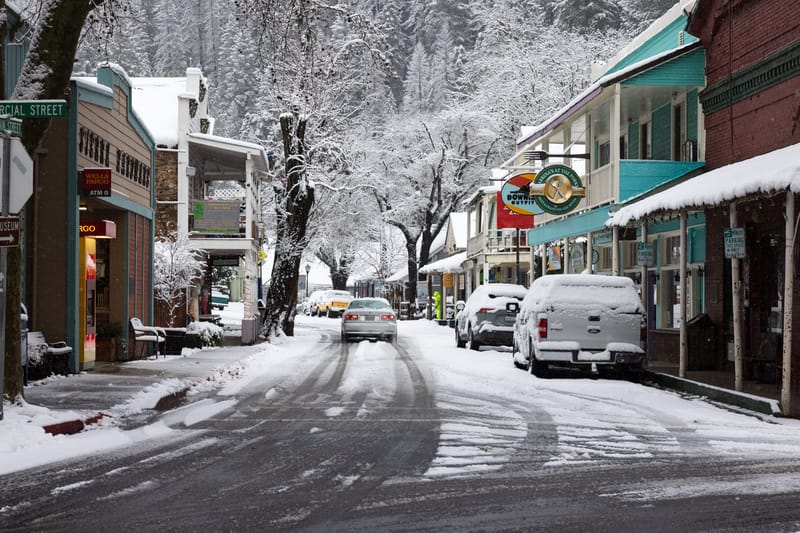
Downieville after snow in March, 2025.
DOWNIEVILLE — The equatorial Pacific has not run this warm since the winter of 2015-16, and federal forecasters say the warming is not finished. In its August 13 diagnostic discussion, the Climate Prediction Center of the National Oceanic and Atmospheric Administration reported sea surface temperatures more than 2 degrees Celsius above average across the eastern equatorial Pacific and put the odds of a very strong El Niño during the coming fall and winter at greater than 90 percent. For the October through December season, the center gave a 69 percent chance of an event stronger than any El Niño in a record that begins in 1950.
Seven days later, the same agency redrew its winter map for California. In the seasonal outlook issued on August 20, forecasters wrote that they had raised the probability of above-normal precipitation “significantly to above 50 percent across much of coastal California and adjacent areas of southern Arizona” for the three-month periods running from December through April, with the wet signal covering the most ground in January, February, and March. They pointed to recent strong El Niños centered in the eastern Pacific, noting that February 1998 and February 2024 ranked among the wettest Februaries in the last 100 years for parts of California.
The strength forecast rests on the ocean beneath the surface as much as on the surface itself. The Climate Prediction Center reported that subsurface temperatures in the equatorial Pacific ran as much as 10 degrees Celsius above normal at depth during July, a pool of stored heat that can feed further warming at the surface. The International Research Institute for Climate and Society, which compiles forecasts from 26 models, reported in mid-August that 25 of them put the October through December Niño 3.4 index in the very strong category, and that 15 of them expect a reading of 3 degrees Celsius or higher. The institute put the week centered on August 12 at 2.7 degrees Celsius above average, three-tenths of a degree below the warmest week in its weekly records, which begin in 1990 and peak in November 2015.
The word “historic” carries a technical definition here. NOAA judges record strength using the Relative Oceanic Niño Index, which subtracts the warming of the tropical oceans as a whole so a modern event is not credited with heat from long-term warming. To qualify as historic, the index would have to average 2.5 degrees Celsius or more across three months.
For a county where Highway 49 climbs from 2,966 feet at Downieville to 6,702 feet at Yuba Pass, the useful question is not whether the ocean is warm. It is whether warm water thousands of miles away reliably puts snow in the North Yuba canyon. One of the eight rain gauges that define Northern California’s benchmark precipitation index sits in Sierra Valley, and the record it keeps is not so sure.
Eight strong El Niños, eight different winters
The Northern Sierra Precipitation 8-Station Index is the measure the California Department of Water Resources uses to judge how wet a year has been on the west slope north of Lake Tahoe. It averages gauges at Mount Shasta City, Shasta Dam, Mineral, Quincy, Brush Creek, Blue Canyon, Pacific House, and the Sierraville Ranger Station. The department’s average for a full water year, calculated over 1991 through 2020, is 53.2 inches.
Eight winters since 1957 rank as strong or very strong El Niño events. On the index, they run from 88.5 inches in 1982-83, still the second-wettest year on record, and 82.4 inches in 1997-98, down to 36.0 inches in 1991-92 and 36.2 inches in 1965-66, barely two-thirds of normal. The eight average 58.9 inches, about 111 percent of normal, but their median is 54.8 inches, and four of the eight finished below average. Two extraordinary years carry the average almost by themselves.
The most recent strong event, in 2023-24, delivered 48.2 inches, or 91 percent of average. The wettest year the index has ever recorded, 94.7 inches in 2016-17, came the winter after a very strong El Niño had collapsed, under weak La Niña conditions.
Why the signal blurs in the north
A 2018 paper in Geophysical Research Letters examined 25 El Niño events across 69 years and identified only three, in 1957-58, 1982-83, and 1997-98, in which warm water persisted in the far eastern Pacific long enough to reliably deepen the North Pacific low and steer storms into California. Its authors calculated that El Niño accounts for less than half as much month-to-month variation in California rainfall as ordinary atmospheric noise does.
A 2024 study in the same journal traced the gap between wet and dry El Niño winters to how often specific storm patterns set up over the eastern Pacific. Wet weather regimes occurred on 88 days in 1982-83 and 86 days in 1997-98, but on only 55 days in 2015-16. In the two wet years, the wet regimes produced as much as 88 and 76 percent of the season’s total precipitation. Its authors also found that while El Niño makes storms wetter once they reach California, most clearly along the southern coast and in the desert Southwest, it does not strongly influence how often the wet patterns occur in a given season.
Daniel Swain, a climate scientist with the University of California Agriculture and Natural Resources’ California Institute for Water Resources, argues the observed record understates the connection because so few strong events exist to count. In a fact sheet published in August, he wrote that weak and moderate El Niños “tend to exert only modest and/or uncertain effects on California climate,” while “very strong east Pacific-based events (like this year’s) tend to increase confidence in larger and more widespread effects.” He also wrote that El Niño, “even a very strong one,” does not guarantee specific outcomes in California, and that the tilt toward a wet winter is strongest in the central and southern parts of the state.
Swain’s own modeling looks at the extremes. For the ARkStorm 2.0 study, he and a co-author assembled eight month-long megastorms, some taken from the historical record and some plausible under future warming, and found that seven of the eight formed under moderate or strong El Niño conditions. Most shared the same setup: a deep low near the Gulf of Alaska and a strengthened subtropical jet stream, a pairing that aims storms at California and sends them in the back-to-back sequences researchers call families. A study of those families complicates the picture, because the kind most common in El Niño winters lasts longer than the kind typical of La Niña and neutral years but delivers less precipitation across California on average.
The models now looking at the coming winter give a sharper answer. In an August briefing, Swain stepped through the seasonal ensemble from the European Centre for Medium-Range Weather Forecasts, which, for December through February, the heart of the winter, put the odds at 70 to 100 percent that precipitation along the California coast finishes in the wettest third of all winters. He called that “the single strongest predictive signal I have ever seen for California precipitation at seasonal scales by a wide margin,” and said it far exceeded the signal that preceded the 2015-16 El Niño.
The temperature problem
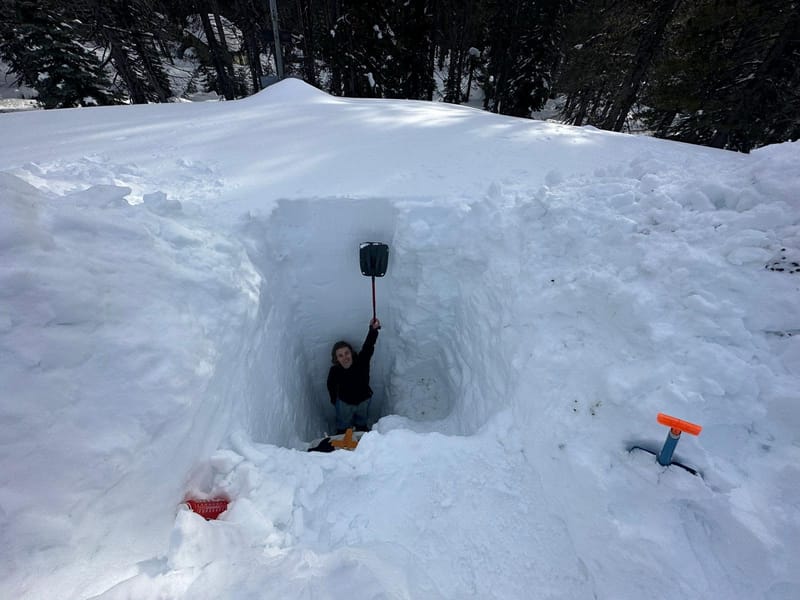
Snowpack at the UC Berkeley Central Sierra Snow Lab in Soda Springs, 2023. The following winter, a strong El Niño cycle, produced far less snow.
UC Berkeley Central Sierra Snow Lab
Precipitation is only half of what Sierra County depends on. The northern Sierra Nevada has a median elevation near 1.6 kilometers, about 5,250 feet, against 2.1 kilometers in the central range and 1.9 kilometers in the south. Researchers writing in the journal Atmosphere in 2018 concluded the lower northern terrain makes the region the most vulnerable stretch of the range to rain-on-snow flooding when storms arrive with high snow levels. A 2017 study in the journal Water found snow levels in the northern Sierra rose measurably between 2008 and 2017, and that unusually warm coastal ocean temperatures favored winters in which less precipitation fell as snow, the same warm coastal water a strong El Niño tends to produce.
Swain addressed the question directly in his August briefing. Asked what a very strong El Niño would mean for mountain snow, he said the Sierra Nevada has “a pretty good chance of having a wetter than average winter, but it’s probably going to be a warmer than average winter.” The highest peaks above 8,000 feet would likely do well, he said, while the lower slopes were a bigger question: “It’s not so much will they get precipitation, but it’s more a question of will it be too warm for snow.” He added that no year as warm as this one globally has yet coincided with a significant El Niño.
The last strong El Niño was an underwhelming example. When state surveyors measured the snowpack on January 30, 2024, statewide precipitation stood at 82 percent of average for the date while the snowpack sat at 52 percent. “Many of these storms have also been warmer than average and produced more rain and less snow, a far cry from last year’s near-record snowpack,” Michael Anderson, the state climatologist, said at the time. Colder storms in February and March rescued the season, and the April 1 snowpack finished at 110 percent of average.
Last winter followed a similar pattern. The 8-Station Index stood at 50.8 inches on August 21, 97 percent of average for the date, an unremarkable year for precipitation. Runoff was another matter: the California-Nevada River Forecast Center put water-year inflow to New Bullards Bar Reservoir on the North Yuba at 70 percent of average. Warm spring weather stripped the snow early, and Homewood Mountain Resort closed its lifts on March 17 with Sierra-at-Tahoe following on March 22.
Downstream effects
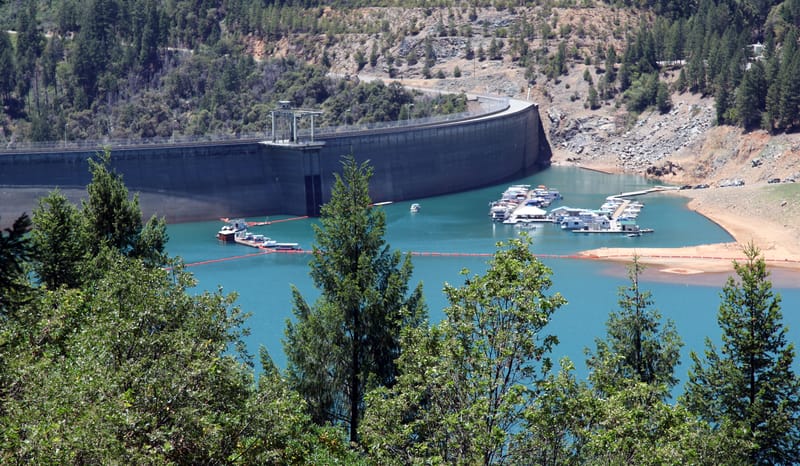
New Bullards Bar Dam in June of 2014.
U.S. Army Corps of Engineers Sacramento District
Almost everything that falls on the North Yuba above Downieville ends up in New Bullards Bar Reservoir. On August 14, the reservoir held 772,494 acre-feet, 80 percent of its 966,000 acre-foot capacity and about 110 percent of average for the date, according to the California Data Exchange Center, even though the basin’s own runoff ran 30 percent below normal for the year.
The basin’s benchmark flood arrived without any help from El Niño. During the week that began December 26, 1996, the northern Sierra averaged about 20 inches of precipitation, roughly 40 percent of what the region normally receives in an entire year, and Blue Canyon, one of the eight index gauges, took in more than 30 inches. Almost none of it fell as snow, because temperatures stayed above freezing as high as about 9,000 feet, and on January 2 the Yuba River at Marysville crested at a record 91.64 feet and 161,000 cubic feet per second. The United States Geological Survey later recorded that the flood occurred during weak La Niña or near-normal ocean conditions. Maurice Roos, then the state’s chief hydrologist, calculated that melting snow supplied around 15 percent of the runoff and wrote that “the bulk of runoff was simply too much rain.”
The Yuba Water Agency has spent the years since buying itself forecasting room. With the Center for Western Weather and Water Extremes at the Scripps Institution of Oceanography, the state department, and the Army Corps of Engineers, the agency is implementing forecast-informed reservoir operations at New Bullards Bar, and a final viability assessment was completed in 2025. It has also finished design on an Atmospheric River Control spillway with gates 31.5 feet lower than the existing ones, which would raise pre-storm release capacity from 19,000 to 35,000 cubic feet per second at a cost of about $240 million. The spillway has not been built, and the Army Corps will issue new operating rules for the dam when it is finished. The Scripps center attributes more than 90 percent of the region’s flood damage to atmospheric rivers.
What to watch
Swain’s fact sheet places peak El Niño effects in California by November or December, possibly lingering into March, and advises that preparations be complete by then. The Climate Prediction Center issues its next precipitation outlook on September 17. The state department’s first manual snow survey of the season is due at Phillips Station around the first of January; the previous one, taken on December 30, 2025, measured 5 inches of water content, half the average for that date.